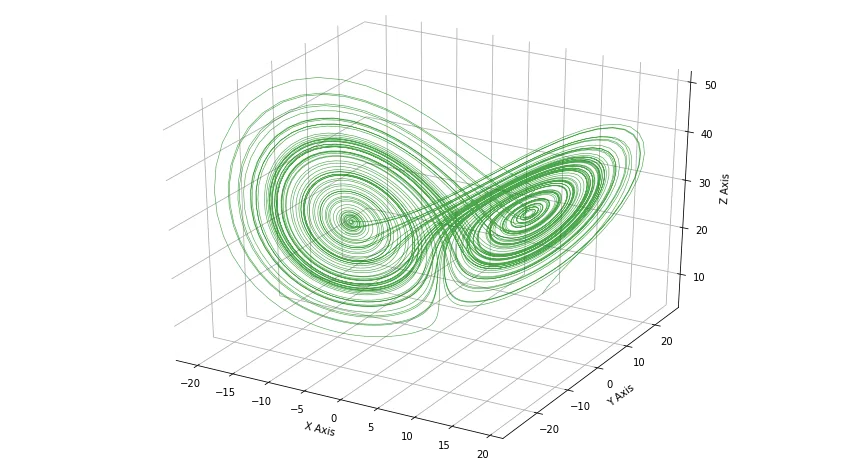
Imagine a world where even the smallest butterfly can destroy the whole planet. It sounds ridiculous, right? However, there may be some truth in it. In the mid-twentieth century the mathematician Edward Lorenz developed a simple mathematical model of atmospheric convection. The model contains a system of three ordinary differential equations which we now know as the Lorenz equations:
These equations show that if we change the initial conditions even a little bit, we get a different output. Here is the tricky part: the output is fundamentally different, not just slightly off. This behaviour is called chaotic and it is the reason why many physical systems are fundamentally unpredictable.
Solving the Lorenz system
There are many methods to solve this system. We will use the easiest one, the Euler method. First let us understand how it works on the equation
The formula is
where is the step. With :
, , , .
Now we apply the same idea to the Lorenz system:
import numpy as np
import matplotlib.pyplot as plt

sigma, rho, beta = 10, 28, 8 / 3
h, t = 0.01, 10000

x = np.empty(t + 1); y = np.empty(t + 1); z = np.empty(t + 1)
x[0], y[0], z[0] = 10, 10, 10

for i in range(t):
    x[i + 1] = x[i] + h * (sigma * (y[i] - x[i]))
    y[i + 1] = y[i] + h * (x[i] * (rho - z[i]) - y[i])
    z[i + 1] = z[i] + h * (x[i] * y[i] - beta * z[i])

fig = plt.figure(figsize=(12, 9))
ax = fig.add_subplot(projection="3d")
ax.plot(x, y, z, color="g", alpha=0.7, linewidth=0.5)
plt.show()
Sensitivity to initial conditions
Run the same loop for three starting points that differ by and the trajectories separate after a few seconds of simulated time:

The divergence grows roughly exponentially. A simple chart of the distance between two such trajectories:
How the pieces fit together:
flowchart LR
  A[Initial conditions] --> B[Euler step]
  B --> C{t < T?}
  C -- yes --> B
  C -- no --> D[Plot with matplotlib]